- Downloaded
- 135.2 GB
- Uploaded
- 13.1 TB
- Ratio
- 99.13
- Seedbonus
- 252,905
- Upload Count
- 265 (300)
Member for 9 years
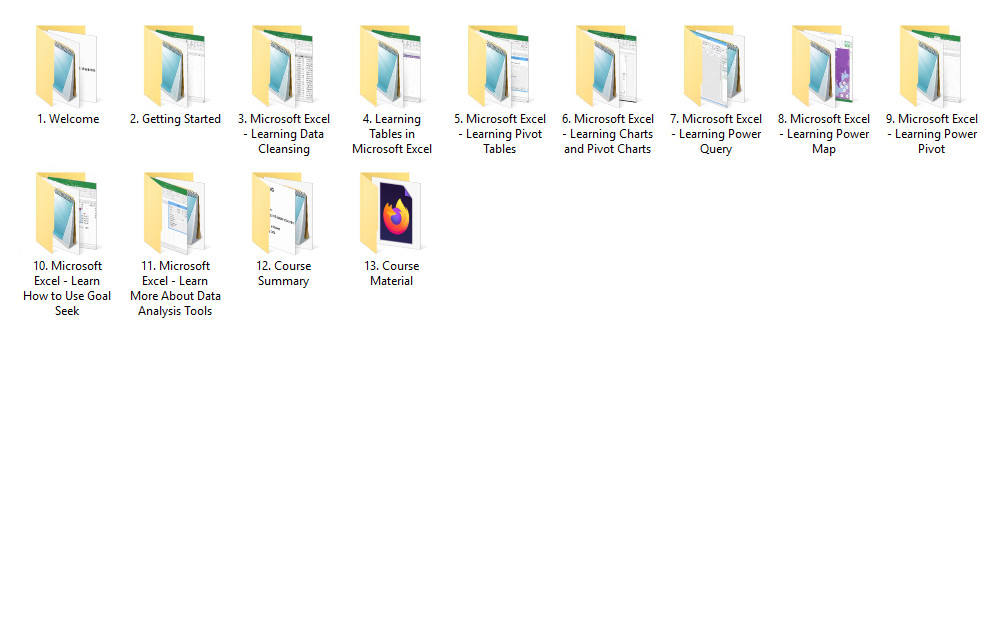
[udemy] The Ultimate Microsoft Excel Data Analytics Course


MP4 | Video: h264, 1280x720 | Audio: AAC, 44.1 KHz, 2 Ch
Genre: eLearning | Language: English + srt | Duration: 87 lectures (8h 32m) | Size: 5.67 GB
This course will teach you advanced Excel techniques
all aimed at helping you make sense of the numbers in your business
What you'll learn
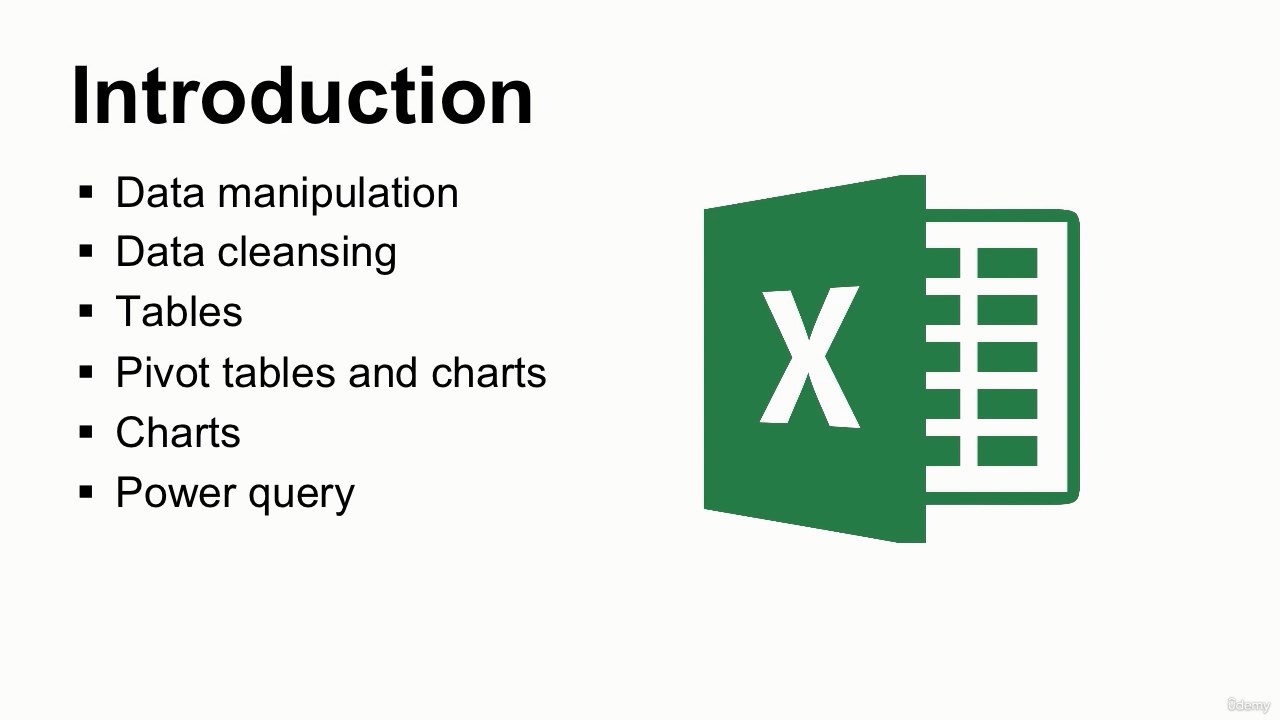
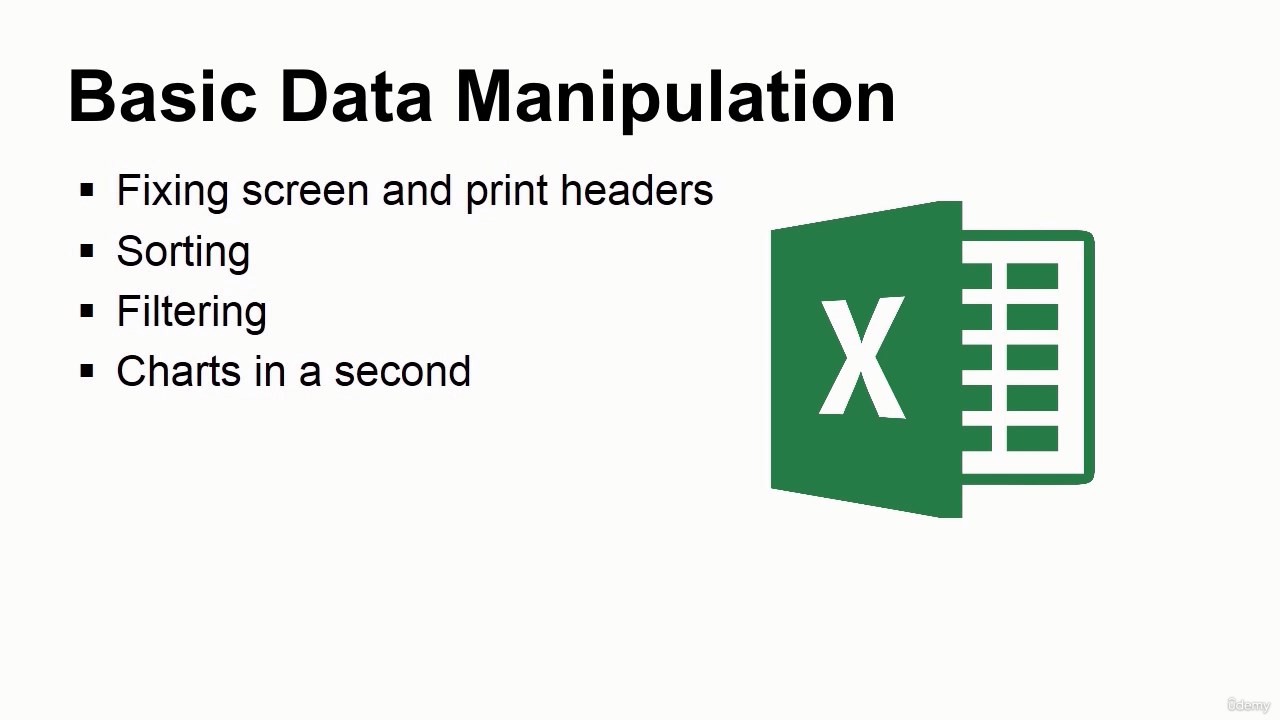
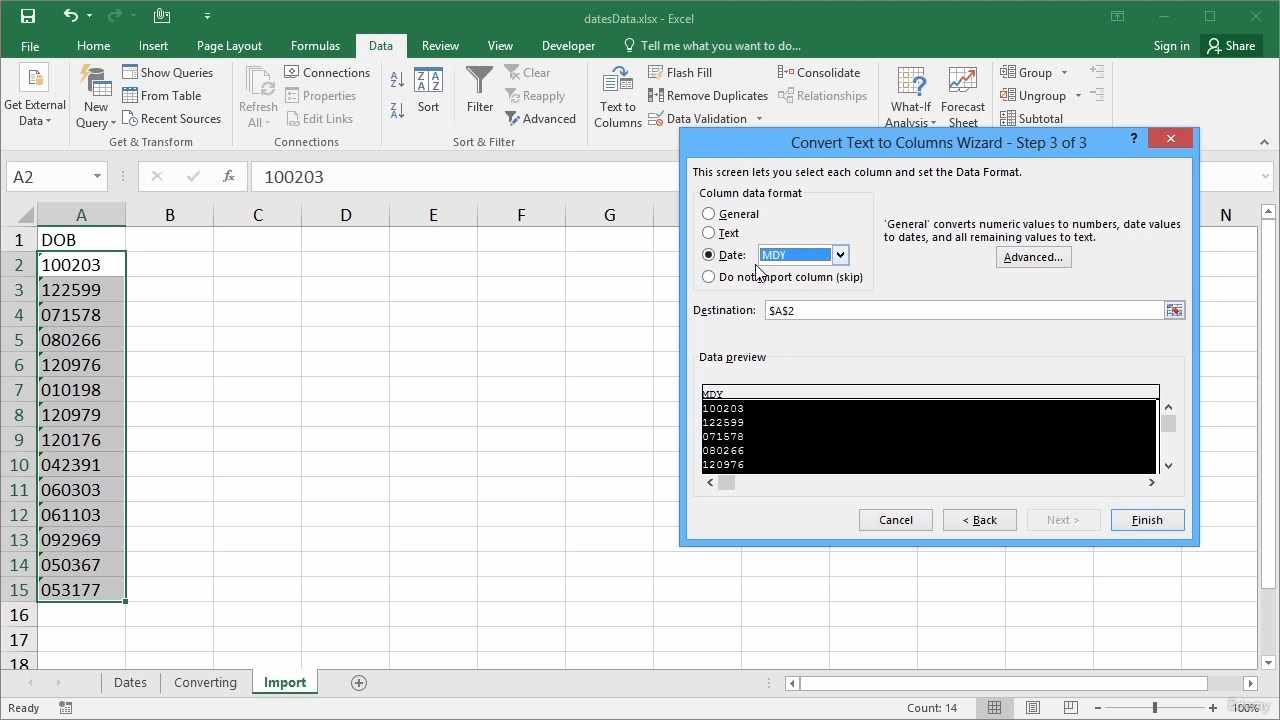
Learn and Understand Data Manipulation using Excel
Learn How to Create Formulas to Help you Analyze Data
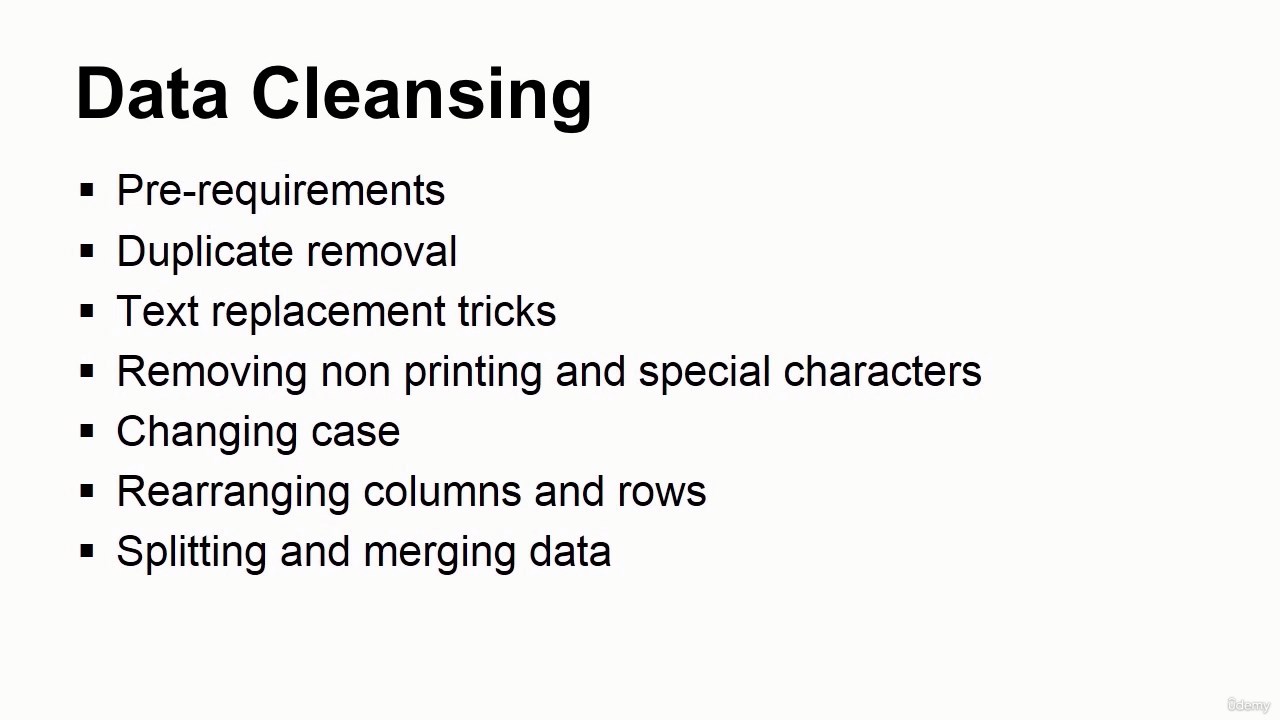
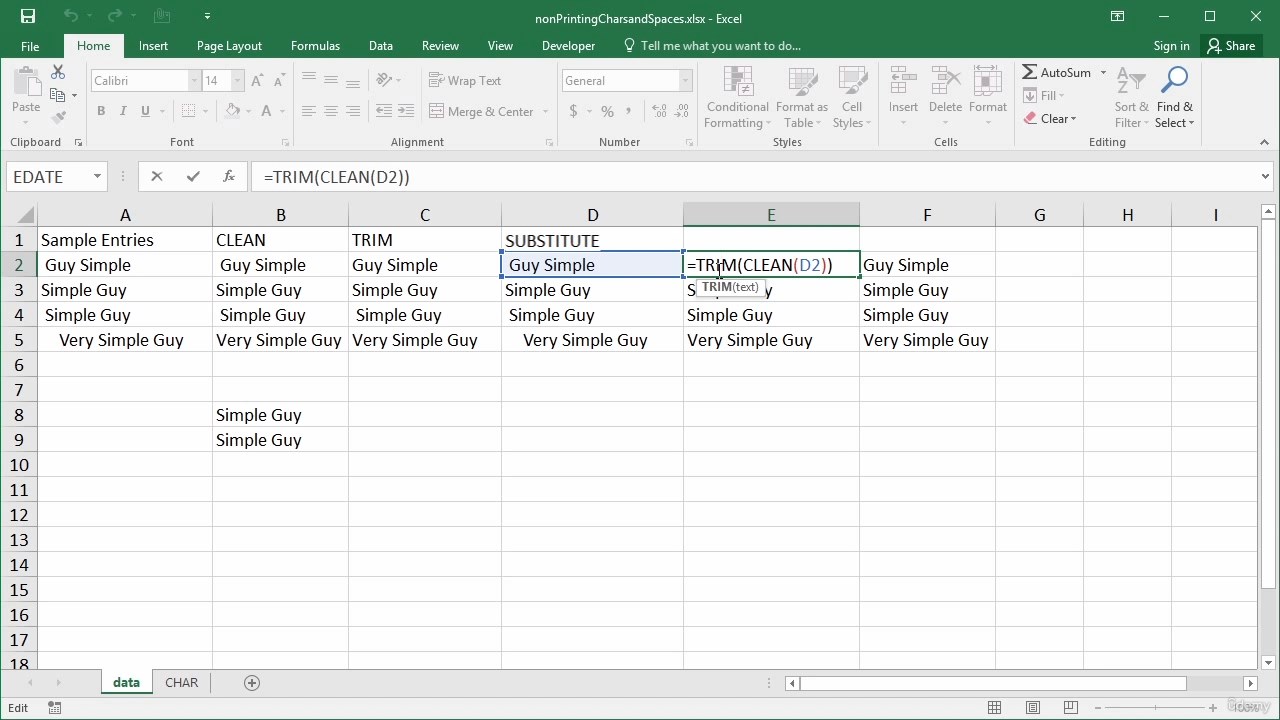
Learn and Understand Data Cleansing
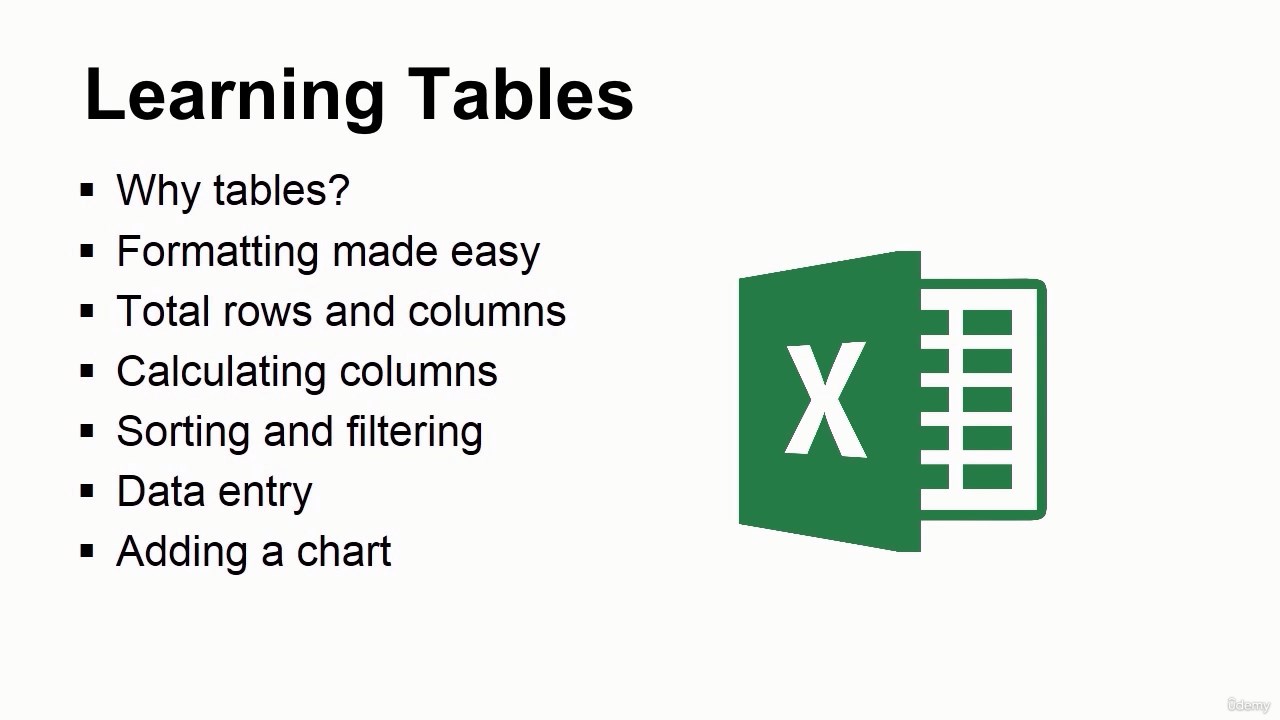
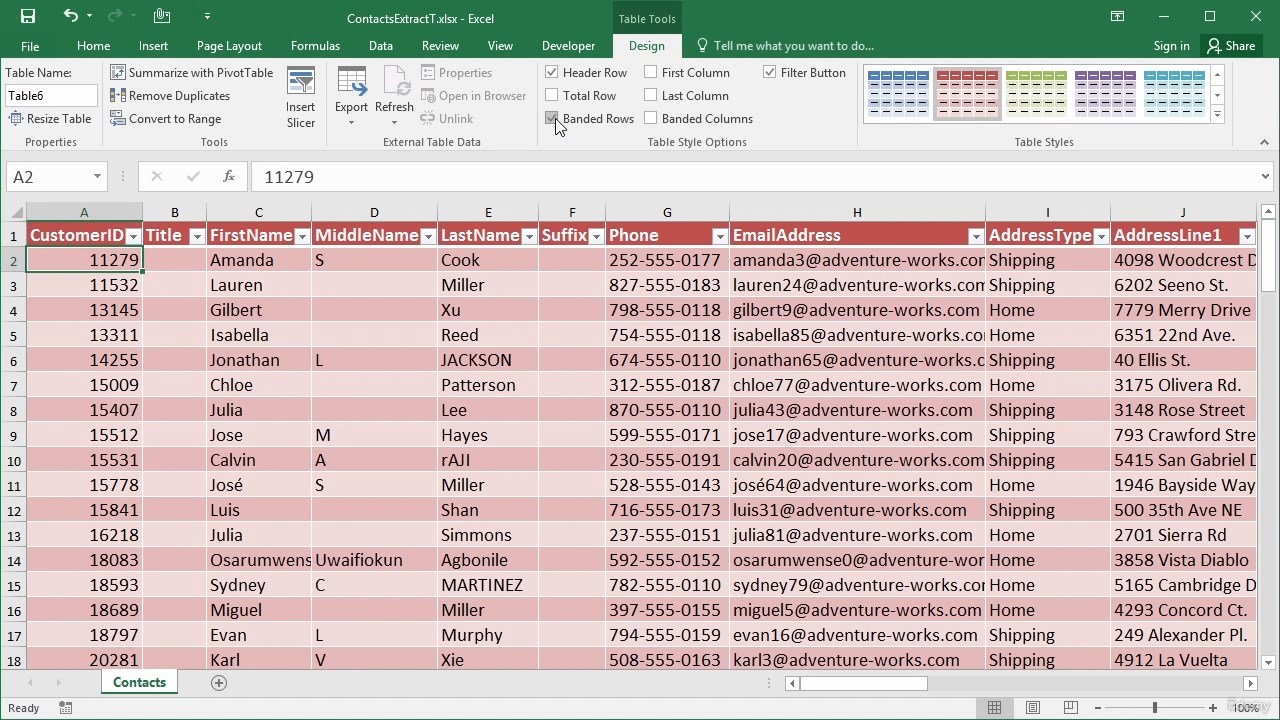
Learn and Understand Tables in Excel
Learn various ways to model data for businesses
Build impressive tables and combine datasets using Excel's built-in functionality
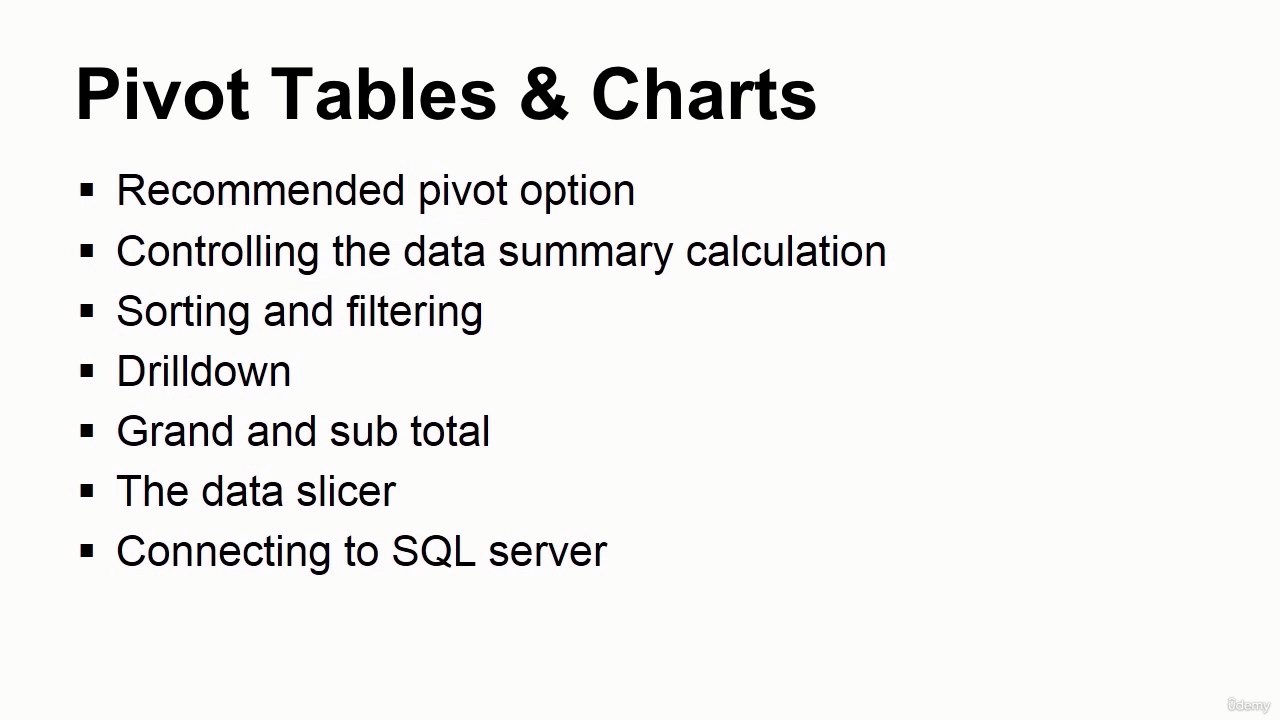
Learn basics of Pivot Tables and Charts
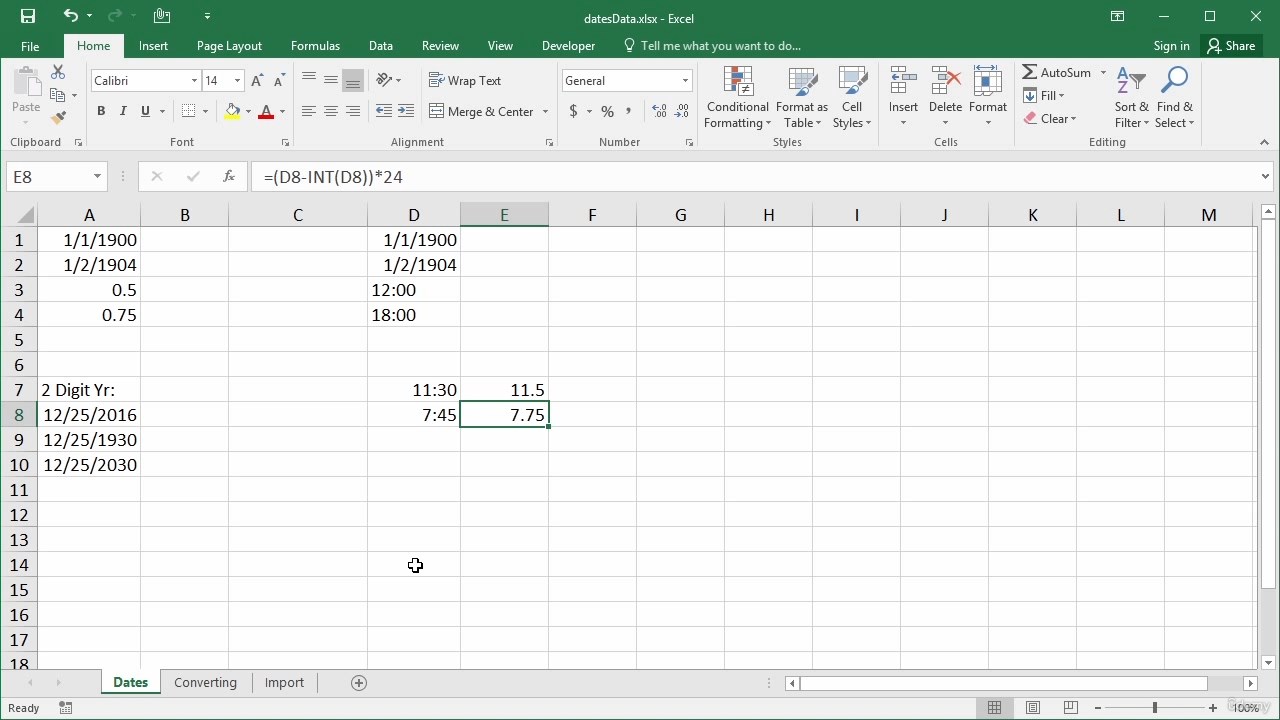
Clean and prepare your data
Create a basic Excel Pivot Table and format numbers in it
Use multiple fields and dimension, and methods of aggregation
Create Pivot Charts based on Pivot Table data
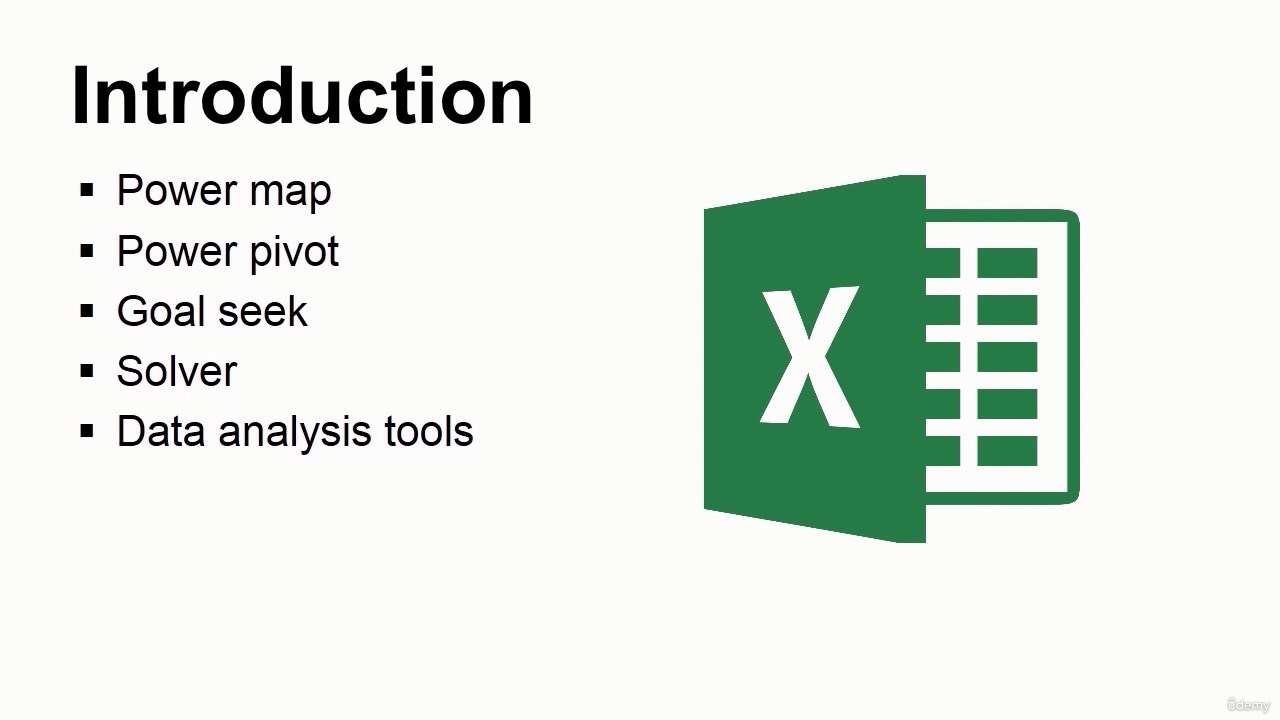
Learning Power Query, Power Map and Power Pivot
Requirements
You have an attitude to learn while having fun")
Basic Excel knowledge is helpful but not required
Who this course is for
This course is for anyone who works with Microsoft Excel even if you’ve never used data analytics, Pivot Table and Pivot Charts
Download
FreeDL
UsersDrive
ClicknUpload
MP4 | Video: h264, 1280x720 | Audio: AAC, 44.1 KHz, 2 Ch
Genre: eLearning | Language: English + srt | Duration: 87 lectures (8h 32m) | Size: 5.67 GB
This course will teach you advanced Excel techniques
all aimed at helping you make sense of the numbers in your business
What you'll learn
Learn and Understand Data Manipulation using Excel
Learn How to Create Formulas to Help you Analyze Data
Learn and Understand Data Cleansing
Learn and Understand Tables in Excel
Learn various ways to model data for businesses
Build impressive tables and combine datasets using Excel's built-in functionality
Learn basics of Pivot Tables and Charts
Clean and prepare your data
Create a basic Excel Pivot Table and format numbers in it
Use multiple fields and dimension, and methods of aggregation
Create Pivot Charts based on Pivot Table data
Learning Power Query, Power Map and Power Pivot
Requirements
You have an attitude to learn while having fun
Basic Excel knowledge is helpful but not required
Welcome to this course. Microsoft Excel is one of the easiest to use data analysis tools you will ever come across. We need to analyze data these days since we live in a very data-driven world. Therefore, data is important in any business, whether you are looking for trends or forecasting future business needs. As there is a lot of importance placed on data analysis, you must have the relevant skills to analyze data effectively. Microsoft Excel has a battery of supplied functions to answer statistical, engineering and financial needs. In addition, it can display data as line graphs, histograms and charts, and with a very limited three-dimensional graphical display. Its simplicity and powerful features has made it the go to tool for all your data needs. Complex operations with Excel, such as creating charts and graphs, visualization, and analyzing data make it a great tool for managers, data scientists, financial data analysts, and those who work closely with data. Learning data analysis and will help you bring your data skills to the next level.
We’ll start with the basic topics in Microsoft Excel. Then we will create workbooks; enter data into; explore page setup and print options; work with rows, columns, and cells; learn how the Cut, Copy, and Paste option works; understand functions and formulas; and also get introduced to PivotTables, logical, and lookup formulas. After this, we will move towards advanced concepts such as lookup and advanced lookup functions, financial functions including calculating interest and depreciation, statistical functions, learning how to connect to other workbooks and datasets outside of Excel, and creating awesome visualizations using sparklines and data bars. You will gain an in-depth understanding of more advanced Excel features that delve into high-level consolidation, analysis, and reporting of financial information.
In this course, you'll learn
Learn and Understand Data Manipulation using Excel
Learn How to Create Formulas to Help you Analyze Data
Learn and Understand Data Cleansing
Learn and Understand Tables in Excel
Learn various ways to model data for businesses
Build impressive tables and combine datasets using Excel's built-in functionality
Learn basics of Pivot Tables and Charts
Clean and prepare your data
Create a basic Excel Pivot Table and format numbers in it
Use multiple fields and dimension, and methods of aggregation
Create Pivot Charts based on Pivot Table data
Learning Power Query, Power Map and Power Pivot
At the end of this course, you’ll learn the skills required to be able to clean the data, put it in the Pivot Table, analyse the data efficiently, and keep it updated with a single click.
Who this course is for
This course is for anyone who works with Microsoft Excel even if you’ve never used data analytics, Pivot Table and Pivot Charts
Download
FreeDL
You must be registered for see links
You must be registered for see links
You must be registered for see links
UsersDrive
You must be registered for see links
You must be registered for see links
You must be registered for see links
ClicknUpload
You must be registered for see links
You must be registered for see links
You must be registered for see links
Last edited:
