- Downloaded
- 135.2 GB
- Uploaded
- 13.1 TB
- Ratio
- 99.13
- Seedbonus
- 255,482
- Upload Count
- 265 (300)
Member for 9 years
[udemy] Statistics & Excel #2-Standard Deviation & Variance-Spread

MP4 | Video: h264, 1280x720 | Audio: AAC, 44.1 KHz, 2 Ch
Genre: eLearning | Language: English | Duration: 21 Lectures ( 5h 57m ) | Size: 4.23 GB
Understanding Variability:
Exploring Measures of Dispersion and Central Tendency
What you'll learn
Define and Calculate Central Tendencies:
You will identify and compute the mean and median for given datasets.
Interpret the Mean:
You will interpret the mean as the balance point of data and recognize its sensitivity to outliers.
Distinguish Between Measures of Center:
You will compare and contrast the mean and median, understanding the conditions under which each measure is most useful
Understand and Apply Measures of Dispersion:
You will calculate and interpret the range, interquartile range, variance, and standard deviation using examples
Analyze Data with Histograms:
You will create and analyze histograms to visually interpret the distribution and spread of data.
Evaluate Data using Five-Number Summary:
You will compute and interpret the five-number summary (minimum, first quartile, median, third quartile, maximum)
Connect Data Analysis to Real-World Contexts:
You will apply measures of center and spread to draw conclusions and make inferences in practical scenarios
Critically Assess Data Distributions:
You will assess the impact of outliers on measures of center and spread, and understand their implications on conclusions
Utilize Correct Formulas for Population and Sample Data:
You will differentiate between population and sample data, applying the correct formulas
Define Central Tendencies in Excel:
Use Excel to calculate and interpret mean and median, understanding their roles as measures of central tendency.
Understand Data Spread:
Utilize Excel to calculate and interpret the five-number summary, gaining insights into data dispersion.
Create Histograms:
Employ Excel to create and analyze histograms, visualizing data distribution and spread effectively.
Calculate Variance and Standard Deviation:
Use Excel functions to compute variance and standard deviation, understanding these measures of spread in depth.
Requirements
Computer Literacy: Familiarity with using computers
Critical Thinking Skills: The ability to think analytically and critically is vital,
as students will be required to interpret data, identify patterns, and draw logical conclusions.
Motivation and Curiosity: A genuine interest in statistics and its applications, along with a curious mind to explore
and understand data, will enhance the learning experience.
Access to Required Tools: Ensuring access to a computer with the necessary software installed,
and a reliable internet connection for research and online resources.
Who this course is for
Undergraduate Students:
Ideal for undergraduates majoring in statistics, mathematics, economics,
psychology, sociology, or any field that requires data analysis.
Business and Finance Majors:
Students majoring in business, finance, or economics,
who need to understand statistical measures to analyze financial data, market trends, and risk assessment.
Social Sciences Students:
Those in sociology, psychology, or political science will find this course beneficial for interpreting data related
to human behavior, societal trends, and research studies.
Health and Life Sciences Students:
Students in fields like biology, public health, and medicine can apply these statistical tools
to analyze research data, patient information, and public health records.
Data Enthusiasts:
Individuals with a passion for data analysis, looking to strengthen their knowledge in statistics
and improve their data interpretation skills.
Aspiring Data Analysts and Statisticians:
Those looking to pursue a career in data analysis or statistics,
and want to build a strong foundation in measures of central tendency and dispersion.
Professionals in Research and Development:
Professionals engaged in research across various fields who require a comprehensive understanding of statistical measures
to analyze and interpret their findings.
Educators and Teachers:
Those in teaching roles looking to enhance their statistics knowledge for more effective instruction.
Download
FreeDL
UsersDrive
ClicknUpload
You will apply measures of center and spread to draw conclusions and make inferences in practical scenarios
Critically Assess Data Distributions:
You will assess the impact of outliers on measures of center and spread, and understand their implications on conclusions
Utilize Correct Formulas for Population and Sample Data:
You will differentiate between population and sample data, applying the correct formulas
Define Central Tendencies in Excel:
Use Excel to calculate and interpret mean and median, understanding their roles as measures of central tendency.
Understand Data Spread:
Utilize Excel to calculate and interpret the five-number summary, gaining insights into data dispersion.
Create Histograms:
Employ Excel to create and analyze histograms, visualizing data distribution and spread effectively.
Calculate Variance and Standard Deviation:
Use Excel functions to compute variance and standard deviation, understanding these measures of spread in depth.
Requirements
Computer Literacy: Familiarity with using computers
Critical Thinking Skills: The ability to think analytically and critically is vital,
as students will be required to interpret data, identify patterns, and draw logical conclusions.
Motivation and Curiosity: A genuine interest in statistics and its applications, along with a curious mind to explore
and understand data, will enhance the learning experience.
Access to Required Tools: Ensuring access to a computer with the necessary software installed,
and a reliable internet connection for research and online resources.
In this course, we delve deep into the realm of descriptive statistics,
with a particular focus on measures of dispersion and central tendency.
The overarching objective of this session is to equip students with the skills and knowledge needed
to transform a list of numbers into structured and meaningful information.
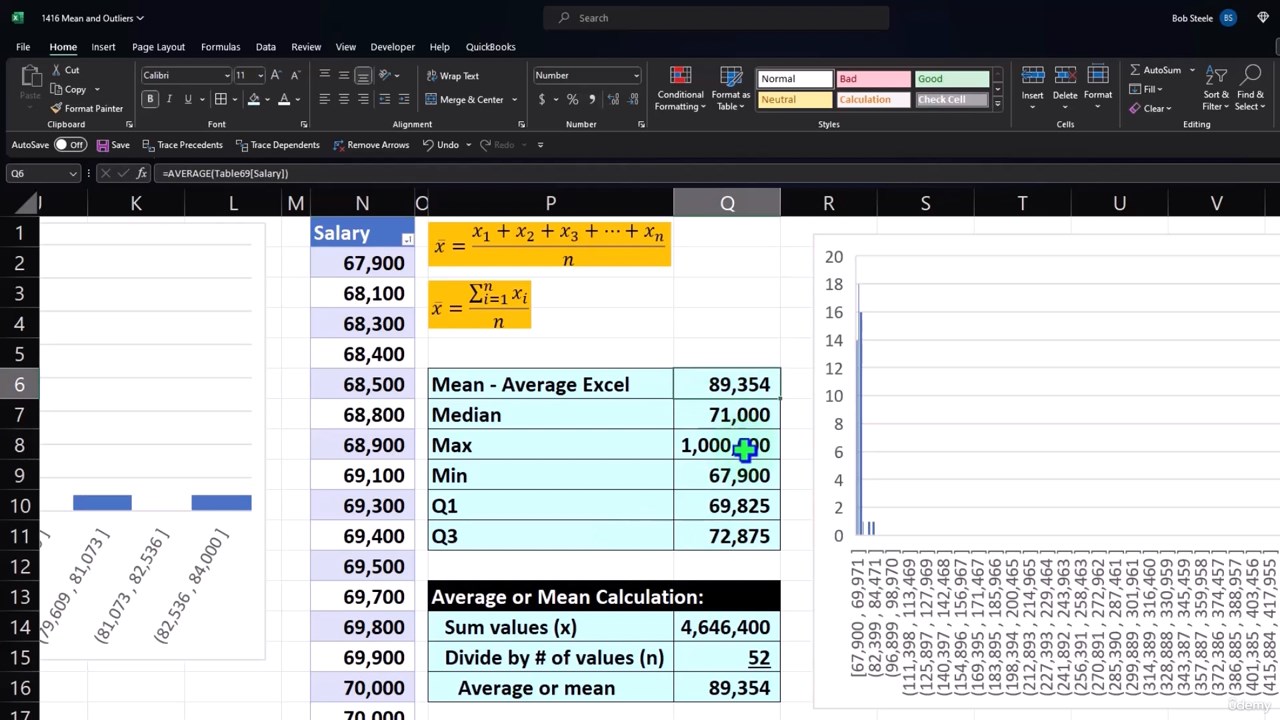
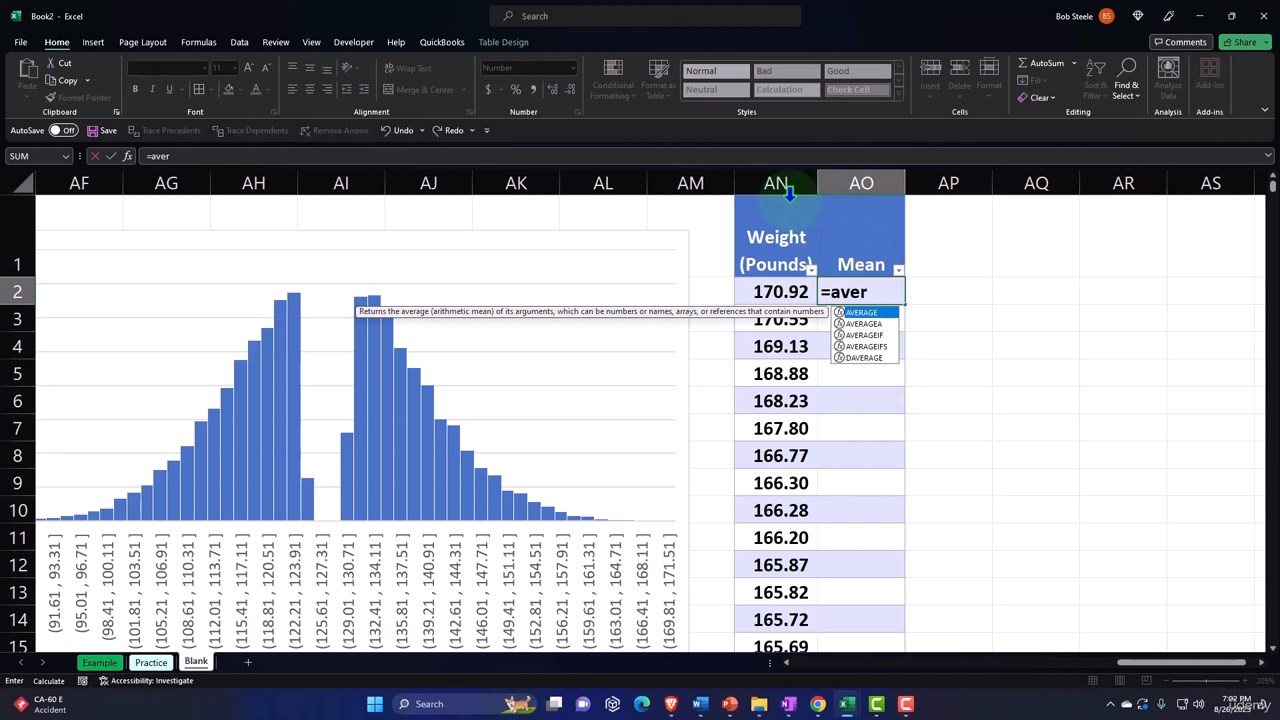
The course begins by exploring measures of central tendency,
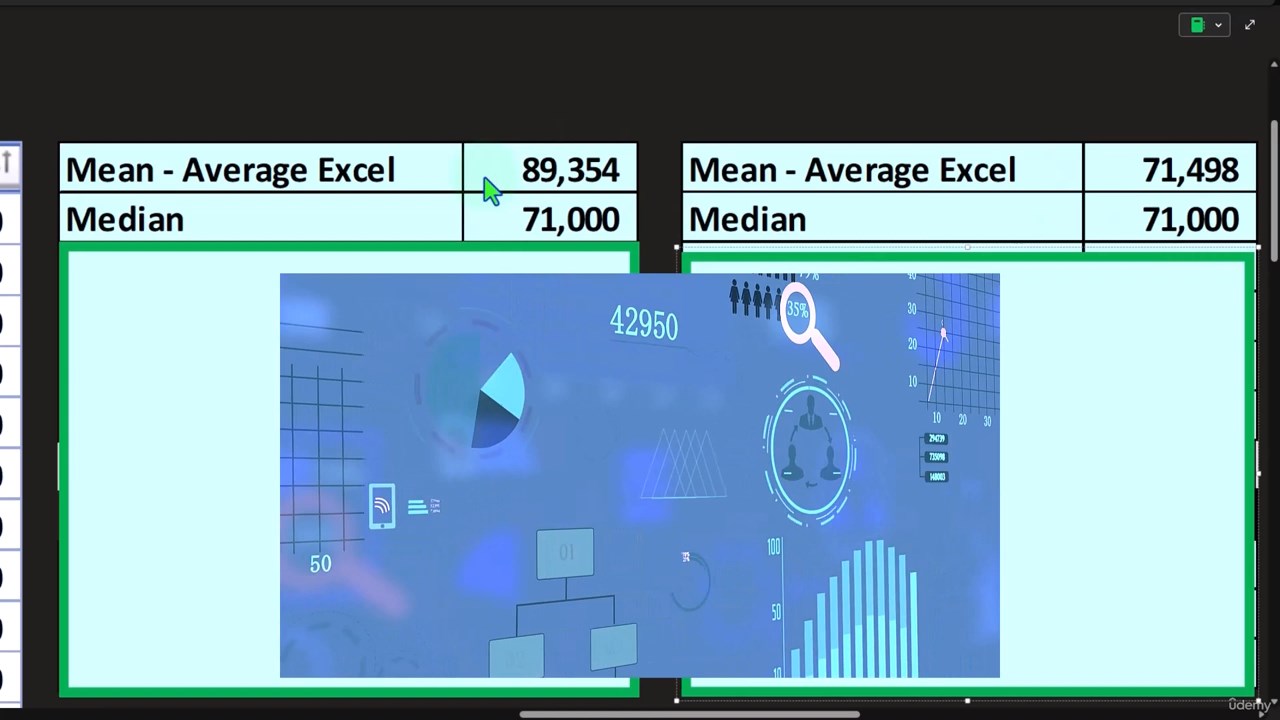
where we will define and discuss the mean and median.
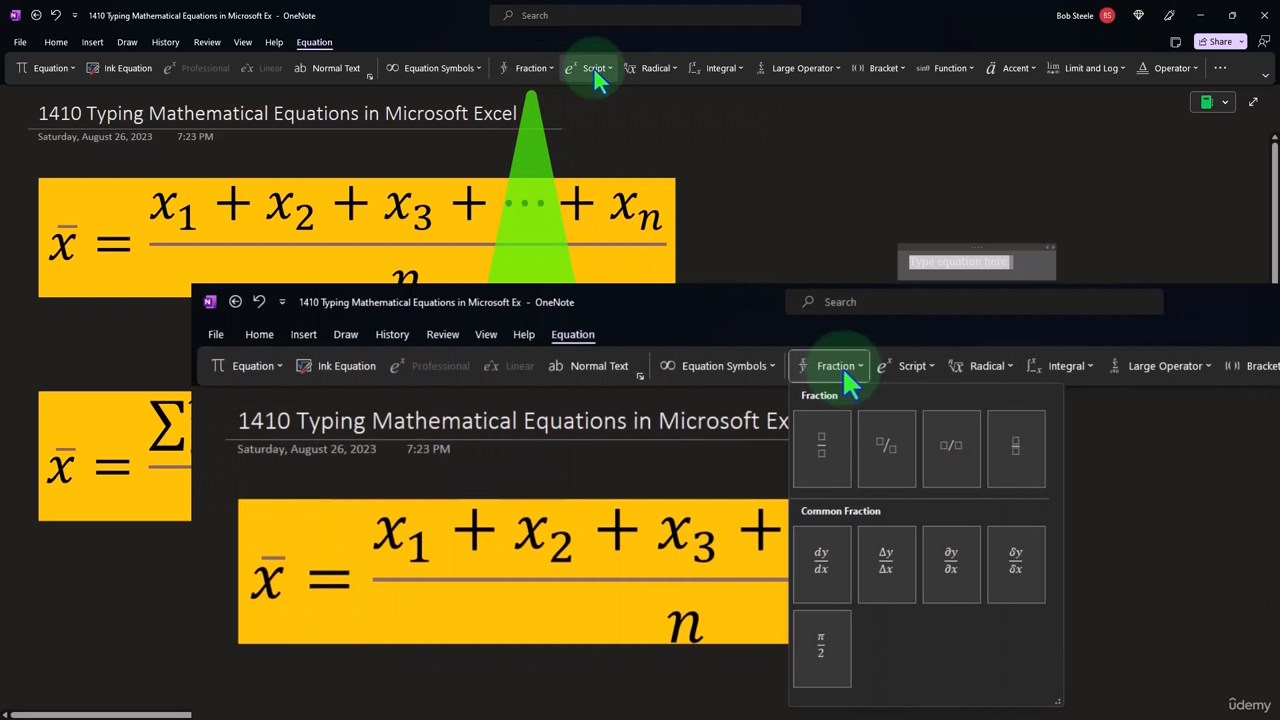
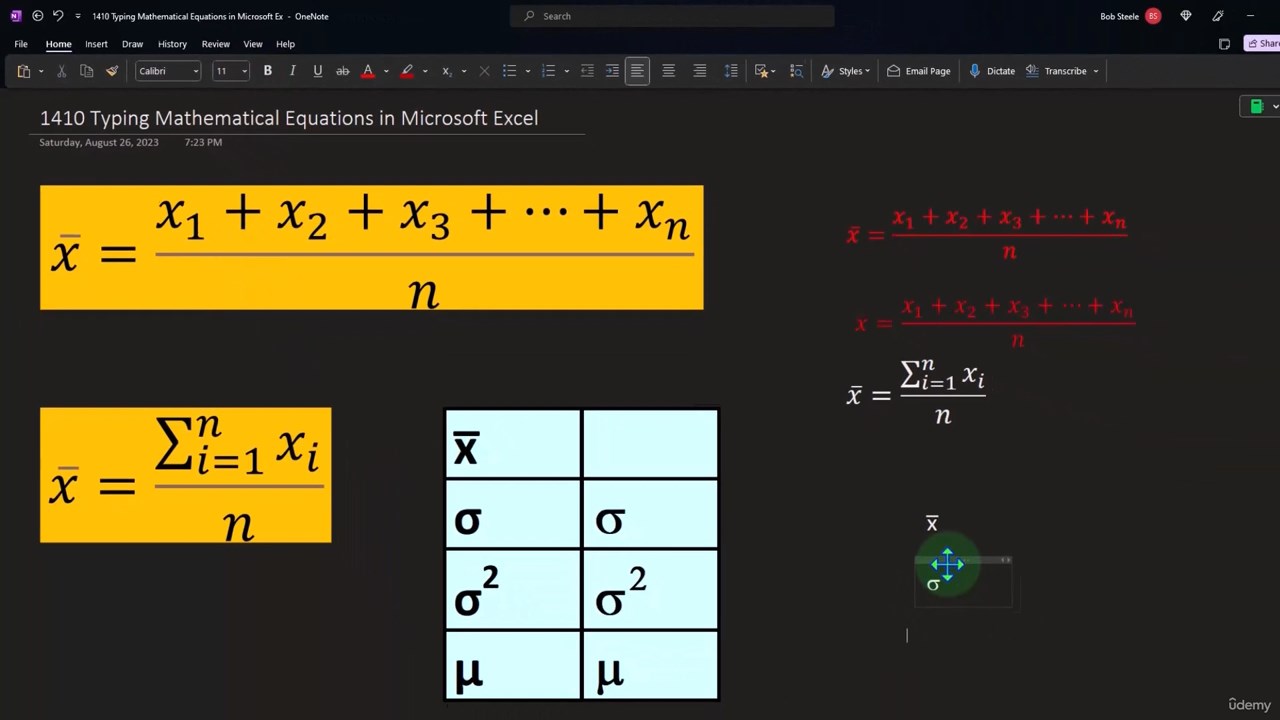
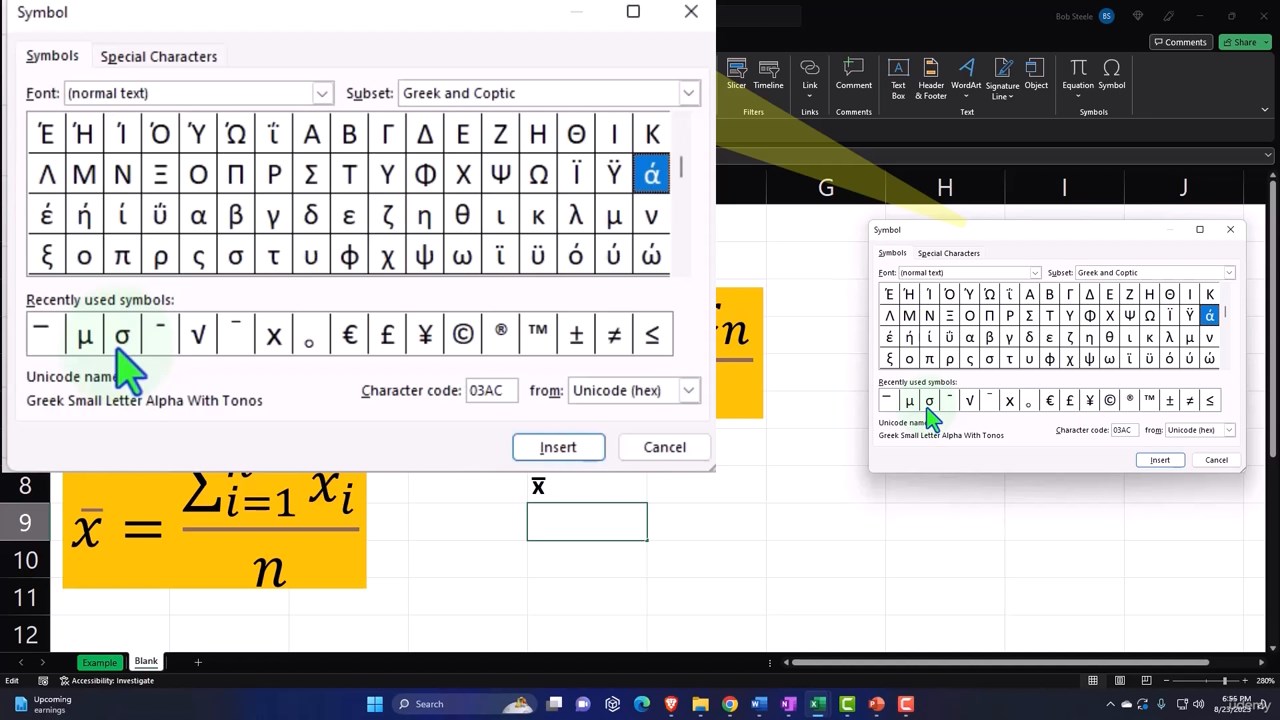
We will explore the mean as the sum of data divided by the number of data items,
denoted as x̅ or μ, and understand its physical interpretation as the balance point of the data.
However, we will also critically analyze how the mean is significantly affected by outliers.
In contrast, the median, being the middle number in an ordered list,
will be introduced as a measure resilient against the effects of outliers.
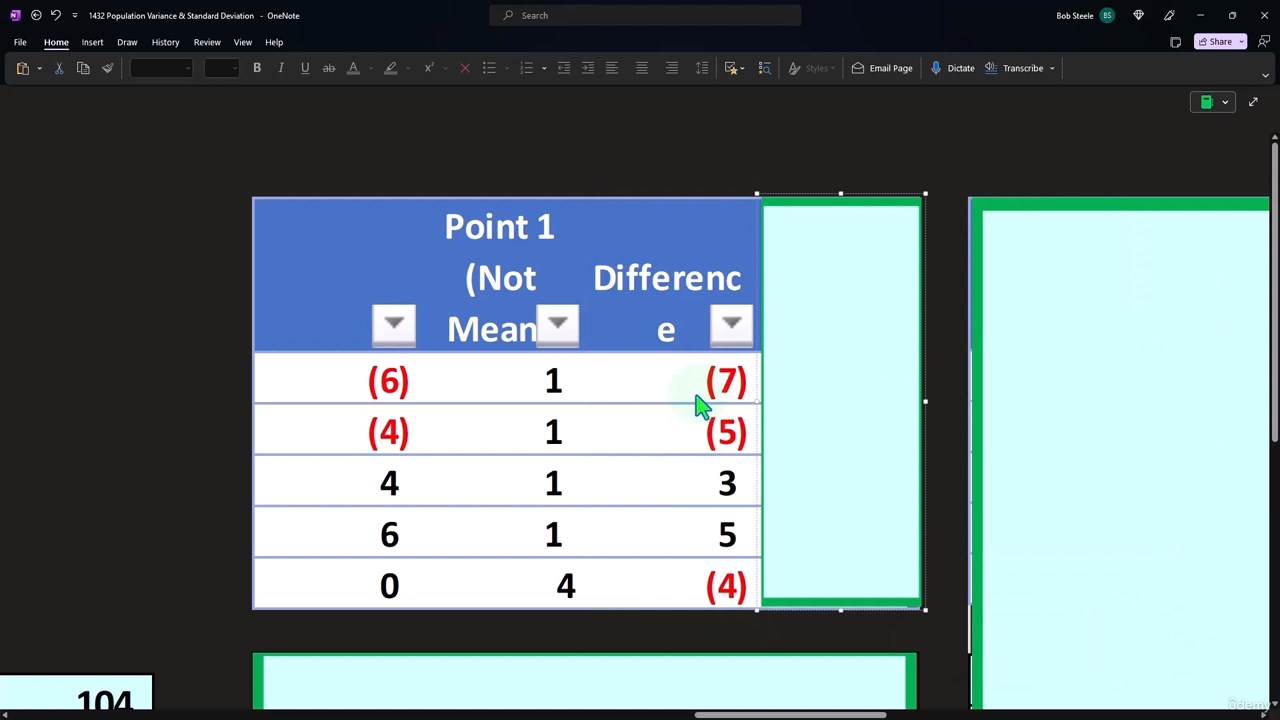
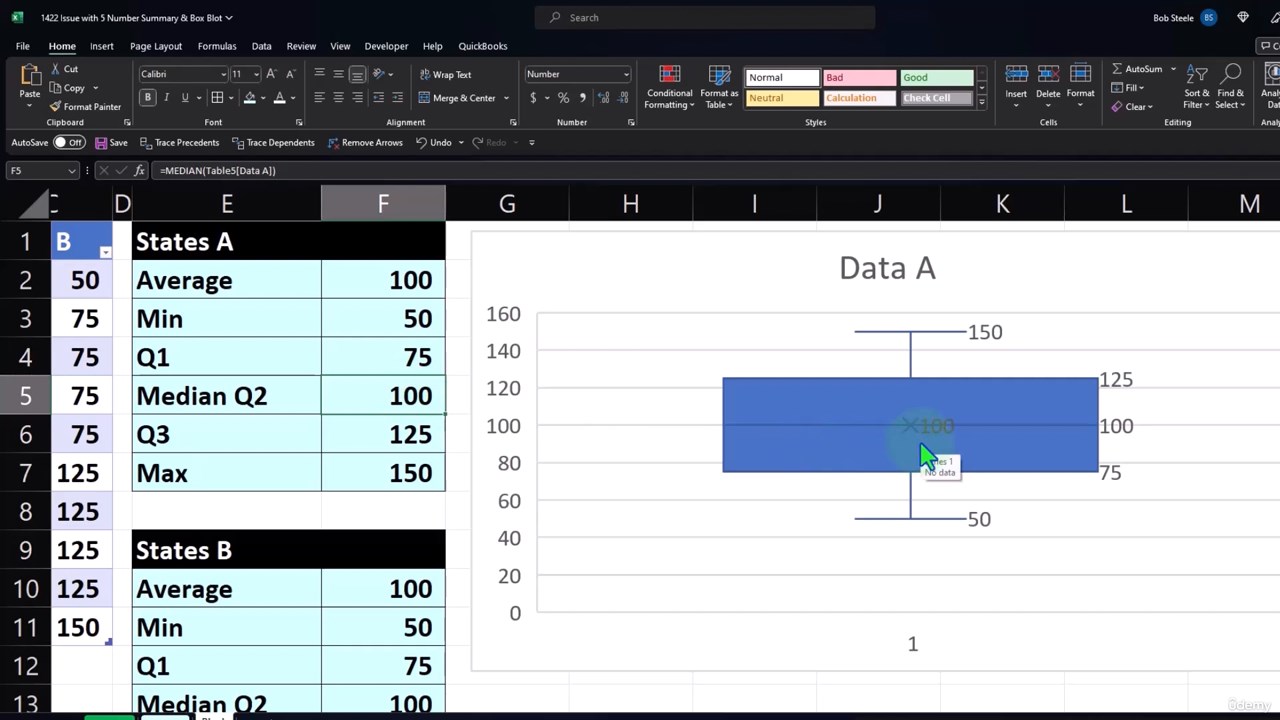
Building on measures of center, we then shift our focus to understanding the spread of data.
Here, we introduce the five-number summary, consisting of the minimum, first quartile,
median, third quartile, and maximum, as a simplistic approach to understanding data dispersion.
Despite its utility, we discuss its limitations in providing a refined sense of data distribution.
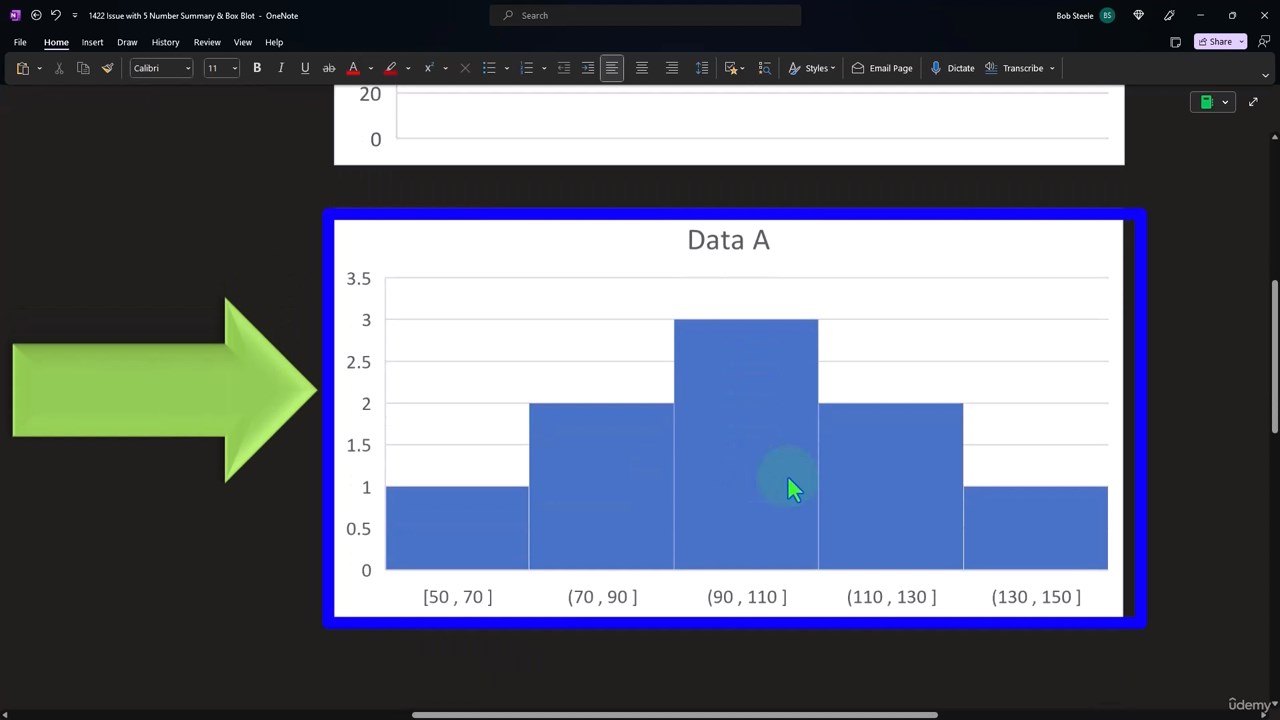
To offer a visual insight into data distribution and dispersion, we introduce the histogram, a powerful graphical tool.
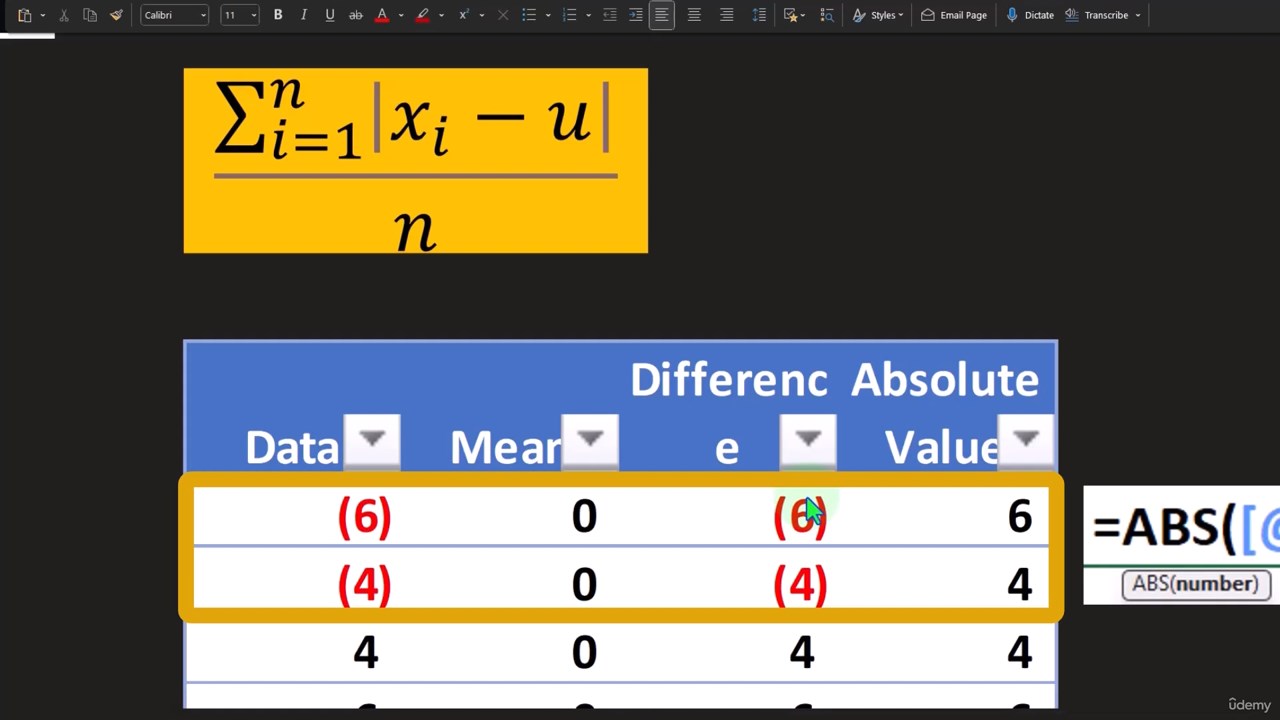
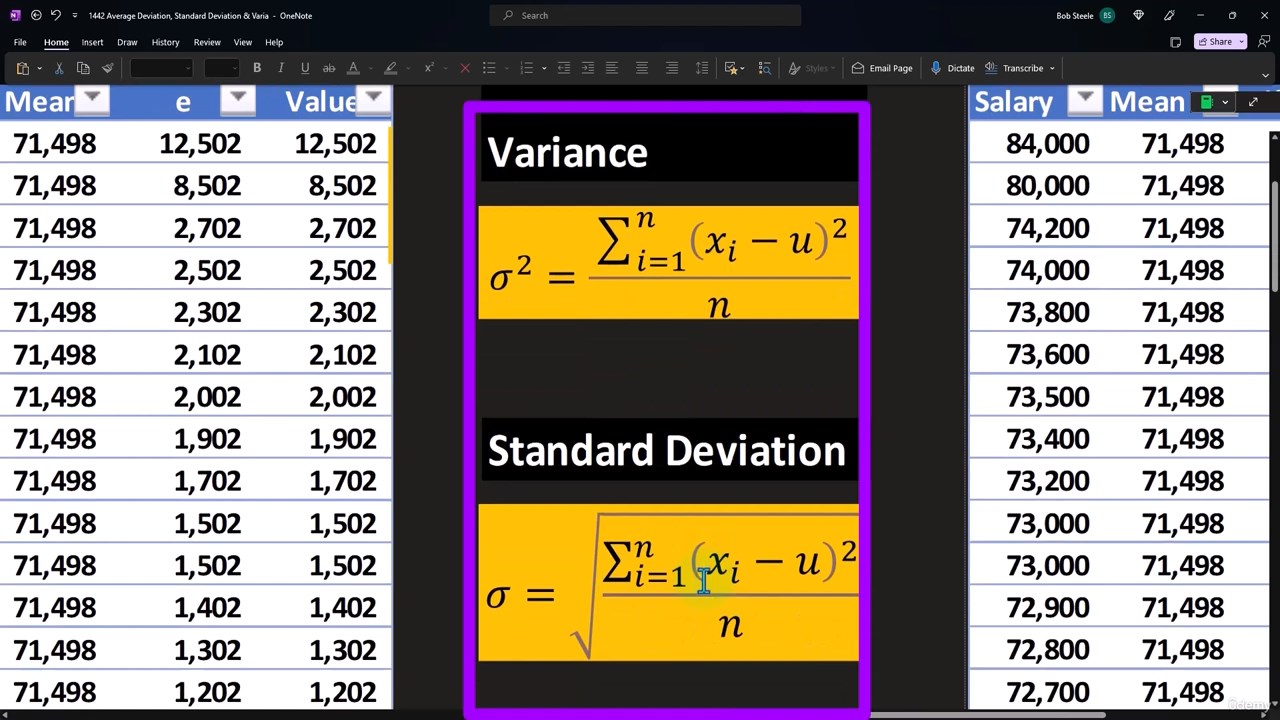
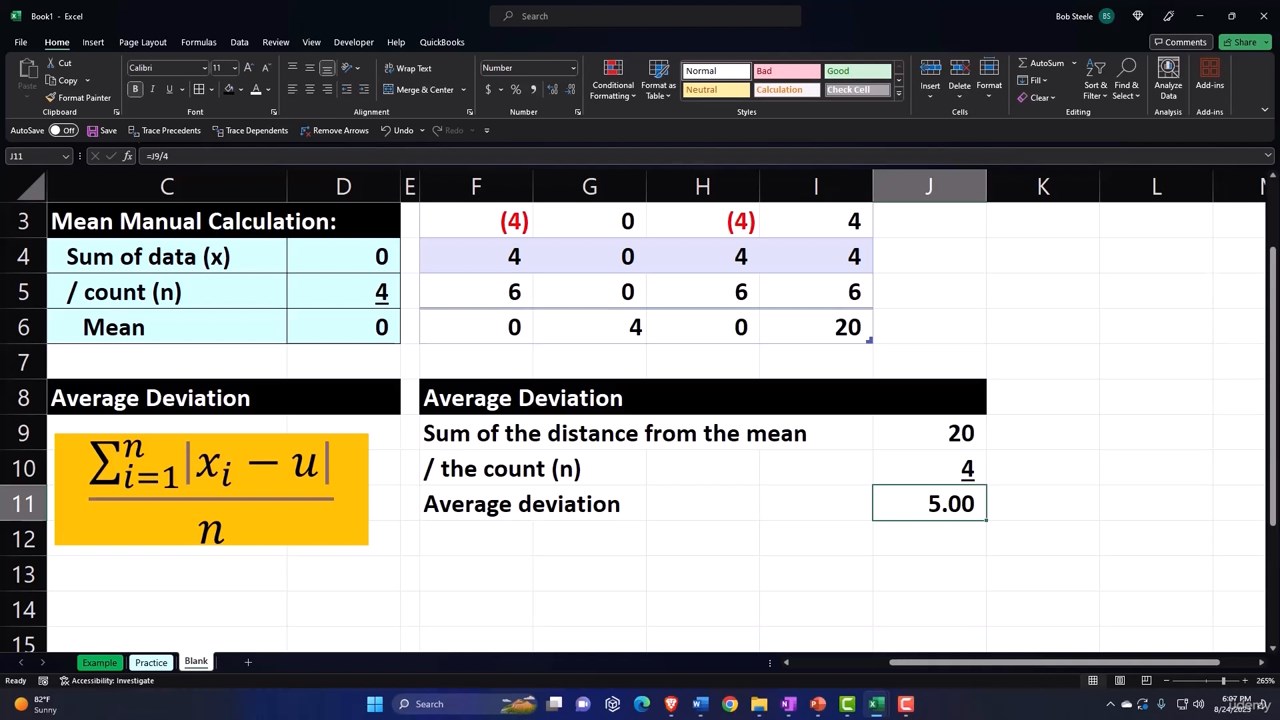
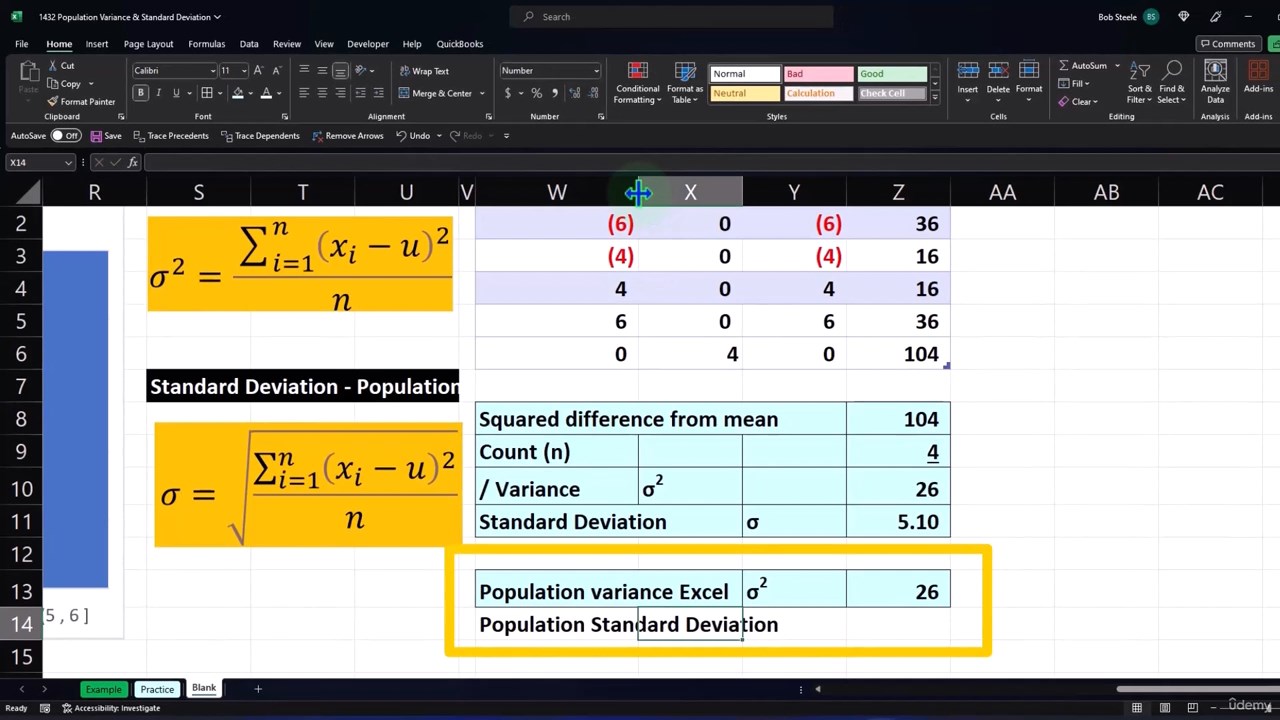
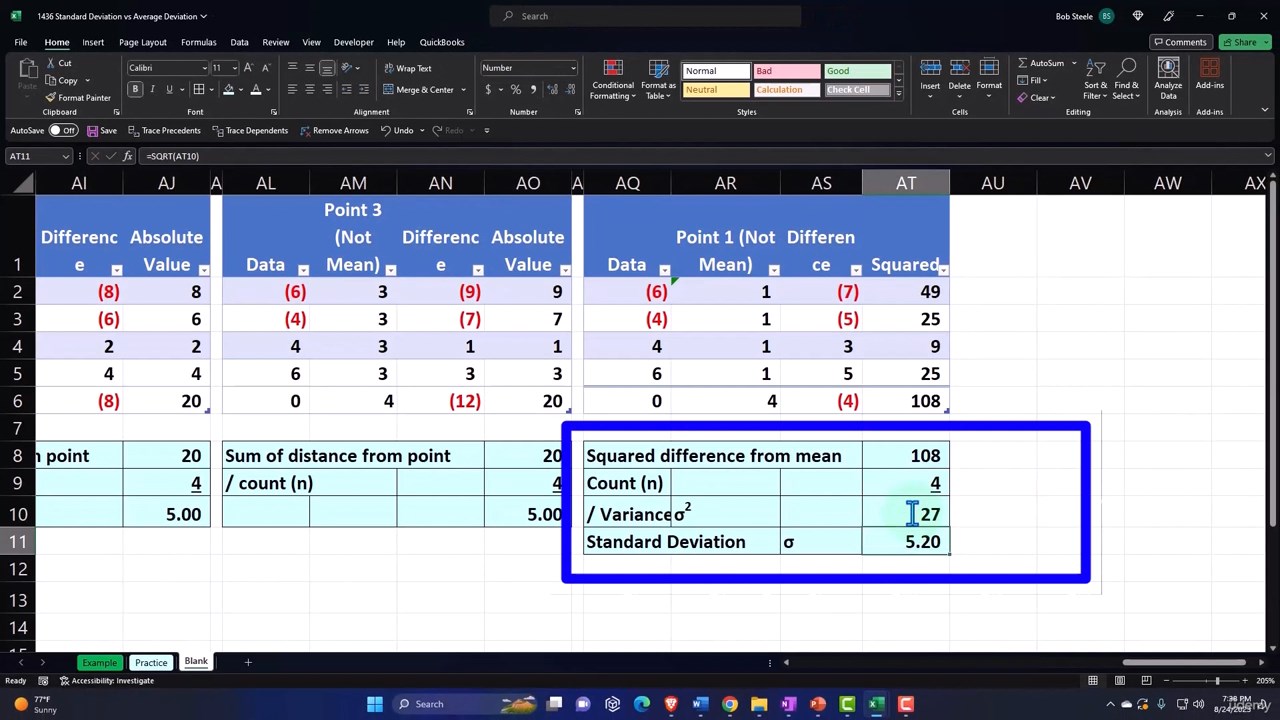
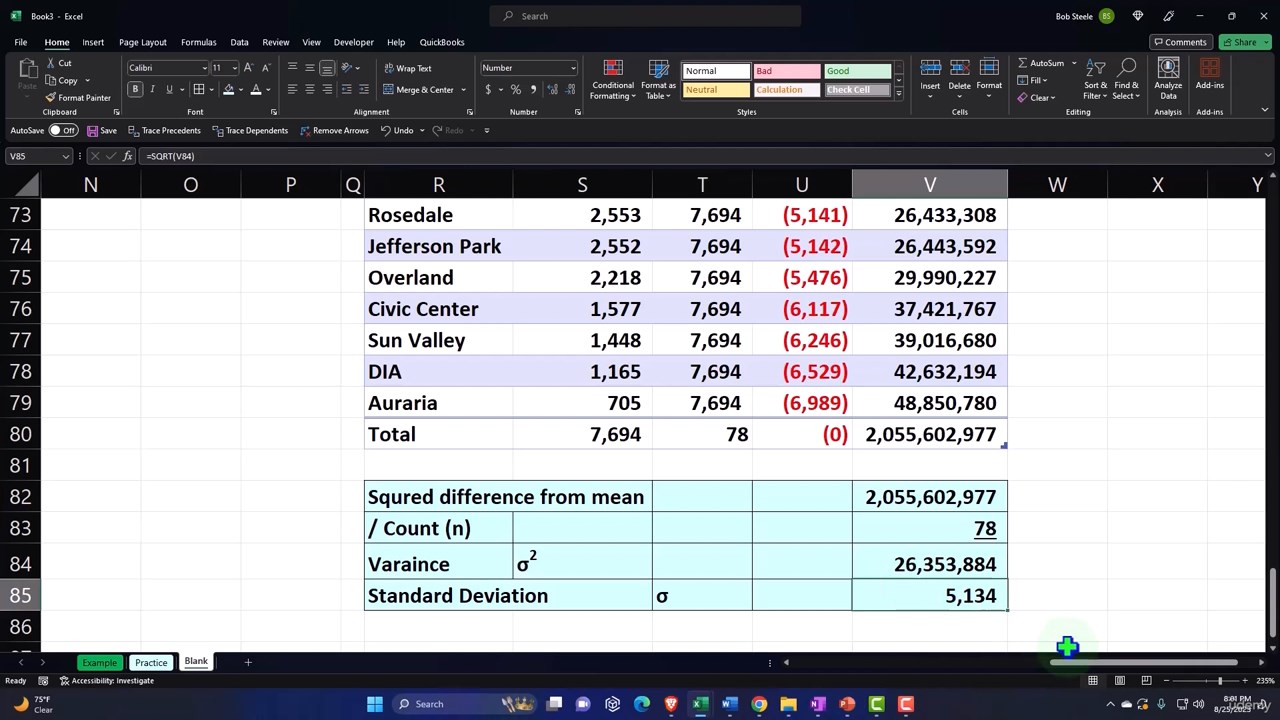
Furthermore, we delve into more nuanced measures of spread such as variance and standard deviation.
Variance, denoted as s² or σ², is defined as the average of the squared differences from the mean,
while the standard deviation is the square root of variance, offering an average distance of data points from the mean.
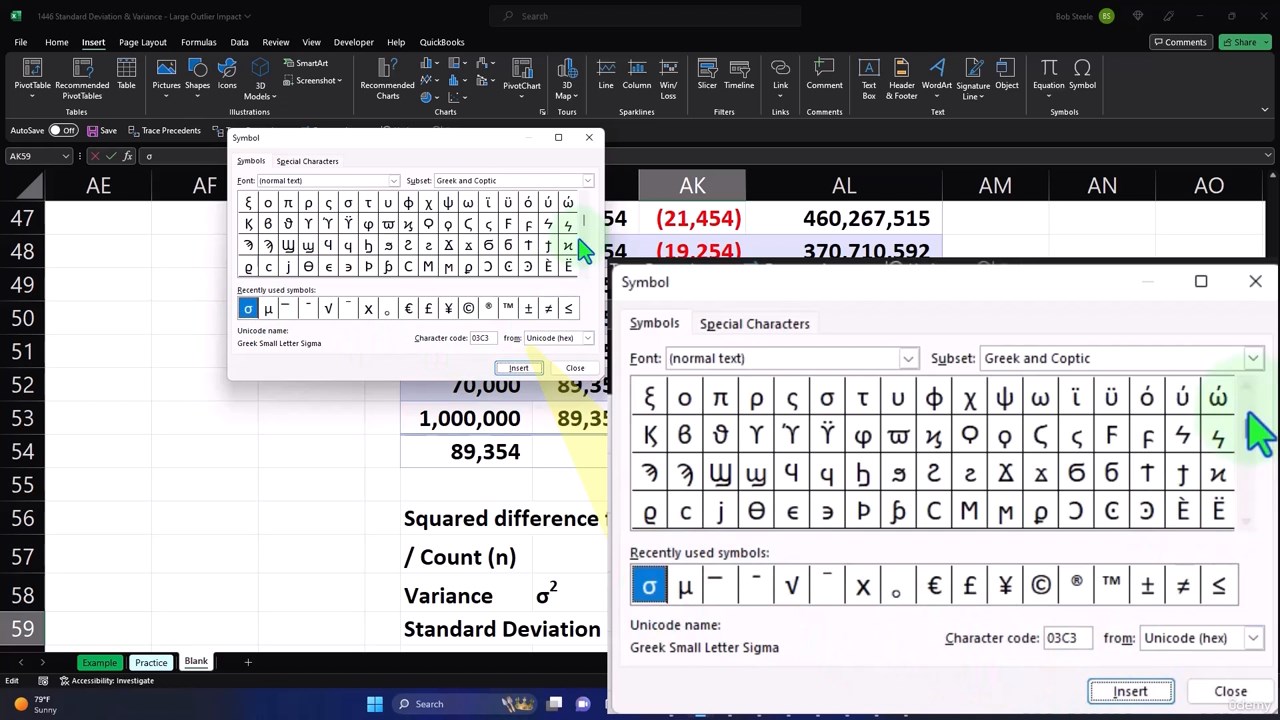
A unique aspect of this course is the critical exploration of why we square differences when calculating variance
and the implications of this in real-world data interpretation.
We emphasize that while these statistical tools provide valuable insights,
the true understanding and meaning come from interpreting data within its context.
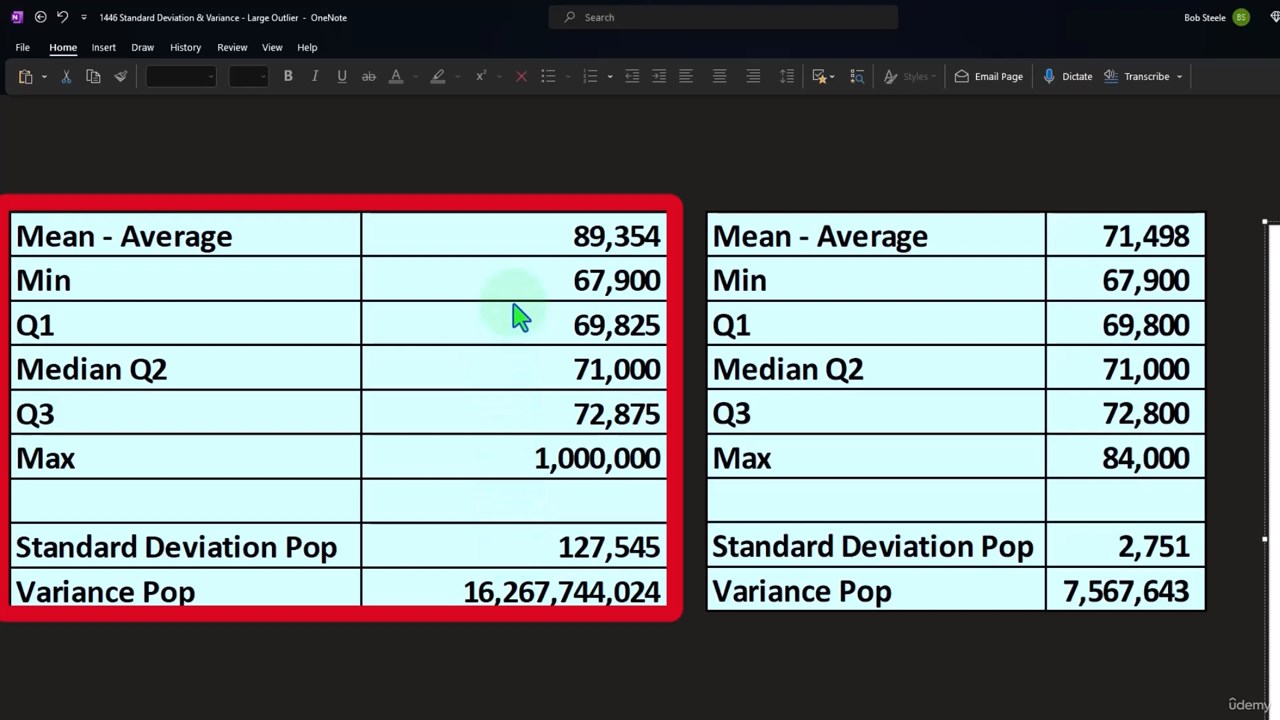
The lecture concludes with practical applications,
illustrating how comparing the dispersion of salaries in large corporations across different countries can offer insights
into varying strategies of incentives and compensation.
This course is designed for students who have a foundational understanding of statistics and are looking
to deepen their knowledge in data analysis.
By the end of this course, students will be well-equipped to analyze complete population data,
understand and interpret measures of central tendency and dispersion, and apply these concepts to real-world scenarios.
with a particular focus on measures of dispersion and central tendency.
The overarching objective of this session is to equip students with the skills and knowledge needed
to transform a list of numbers into structured and meaningful information.
The course begins by exploring measures of central tendency,
where we will define and discuss the mean and median.
We will explore the mean as the sum of data divided by the number of data items,
denoted as x̅ or μ, and understand its physical interpretation as the balance point of the data.
However, we will also critically analyze how the mean is significantly affected by outliers.
In contrast, the median, being the middle number in an ordered list,
will be introduced as a measure resilient against the effects of outliers.
Building on measures of center, we then shift our focus to understanding the spread of data.
Here, we introduce the five-number summary, consisting of the minimum, first quartile,
median, third quartile, and maximum, as a simplistic approach to understanding data dispersion.
Despite its utility, we discuss its limitations in providing a refined sense of data distribution.
To offer a visual insight into data distribution and dispersion, we introduce the histogram, a powerful graphical tool.
Furthermore, we delve into more nuanced measures of spread such as variance and standard deviation.
Variance, denoted as s² or σ², is defined as the average of the squared differences from the mean,
while the standard deviation is the square root of variance, offering an average distance of data points from the mean.
A unique aspect of this course is the critical exploration of why we square differences when calculating variance
and the implications of this in real-world data interpretation.
We emphasize that while these statistical tools provide valuable insights,
the true understanding and meaning come from interpreting data within its context.
The lecture concludes with practical applications,
illustrating how comparing the dispersion of salaries in large corporations across different countries can offer insights
into varying strategies of incentives and compensation.
This course is designed for students who have a foundational understanding of statistics and are looking
to deepen their knowledge in data analysis.
By the end of this course, students will be well-equipped to analyze complete population data,
understand and interpret measures of central tendency and dispersion, and apply these concepts to real-world scenarios.
Who this course is for
Undergraduate Students:
Ideal for undergraduates majoring in statistics, mathematics, economics,
psychology, sociology, or any field that requires data analysis.
Business and Finance Majors:
Students majoring in business, finance, or economics,
who need to understand statistical measures to analyze financial data, market trends, and risk assessment.
Social Sciences Students:
Those in sociology, psychology, or political science will find this course beneficial for interpreting data related
to human behavior, societal trends, and research studies.
Health and Life Sciences Students:
Students in fields like biology, public health, and medicine can apply these statistical tools
to analyze research data, patient information, and public health records.
Data Enthusiasts:
Individuals with a passion for data analysis, looking to strengthen their knowledge in statistics
and improve their data interpretation skills.
Aspiring Data Analysts and Statisticians:
Those looking to pursue a career in data analysis or statistics,
and want to build a strong foundation in measures of central tendency and dispersion.
Professionals in Research and Development:
Professionals engaged in research across various fields who require a comprehensive understanding of statistical measures
to analyze and interpret their findings.
Educators and Teachers:
Those in teaching roles looking to enhance their statistics knowledge for more effective instruction.
Download
FreeDL
You must be registered for see links
You must be registered for see links
You must be registered for see links
UsersDrive
You must be registered for see links
You must be registered for see links
You must be registered for see links
ClicknUpload
You must be registered for see links
You must be registered for see links
You must be registered for see links